The Demand Curve For A Normal Good Is ______________.
Breaking News Today
Mar 26, 2025 · 6 min read
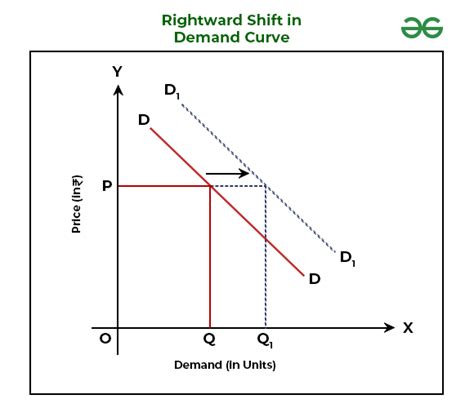
Table of Contents
The Demand Curve for a Normal Good is Downward Sloping: A Deep Dive into Consumer Behavior and Market Dynamics
The demand curve for a normal good is downward sloping. This fundamental principle of economics underpins our understanding of consumer behavior and market forces. While seemingly simple, this statement encapsulates a complex interplay of factors that influence how much of a good consumers are willing and able to purchase at different price points. This article will delve into a comprehensive exploration of this concept, examining the underlying reasons for the downward slope, exploring exceptions and nuances, and considering the implications for businesses and policymakers.
Understanding the Downward-Sloping Demand Curve
The downward slope of the demand curve for a normal good illustrates the law of demand: as the price of a good decreases, the quantity demanded increases, ceteris paribus. This "all else being equal" clause is crucial, as it highlights that we're isolating the effect of price changes on quantity demanded while holding other factors constant. These other factors, which we'll explore later, can shift the entire demand curve.
The downward slope is a direct result of several key consumer behaviors:
1. The Substitution Effect
As the price of a good falls, it becomes relatively cheaper compared to its substitutes. Consumers will substitute the now-cheaper good for the relatively more expensive alternatives. For example, if the price of beef decreases, consumers might switch from chicken or pork to beef, increasing the quantity demanded of beef.
2. The Income Effect
A decrease in the price of a good increases the consumer's real income—their purchasing power. With more disposable income, consumers can afford to buy more of the good, even if they don't necessarily substitute it for anything else. This increased purchasing power leads to a higher quantity demanded. Imagine the price of potatoes dropping significantly. Even if you weren't planning to substitute potatoes for another vegetable, the extra money saved could allow you to buy more potatoes overall.
3. The Law of Diminishing Marginal Utility
This principle states that as a consumer consumes more units of a good, the additional satisfaction (marginal utility) they derive from each additional unit decreases. Therefore, consumers are willing to buy more of a good only if its price falls to compensate for the declining marginal utility. For instance, the first slice of pizza provides immense satisfaction, but the satisfaction diminishes with each subsequent slice. You'd likely only eat more if the price per slice was lower.
Normal Goods vs. Inferior Goods
It's crucial to distinguish between normal goods and inferior goods when discussing the downward-sloping demand curve. A normal good is a good whose demand increases as consumer income rises and vice versa. Examples include most consumer staples like food, clothing, and entertainment. An inferior good, conversely, is a good whose demand decreases as consumer income rises. Examples include generic brands, used clothing, or public transportation (as people might switch to owning a car as their income increases).
The demand curve for an inferior good is more complex and might not always be downward sloping. While a price decrease will still lead to an increase in quantity demanded due to the substitution and income effects, the income effect could work in the opposite direction, potentially leading to a less pronounced or even upward-sloping demand curve in some situations. This article focuses primarily on the more straightforward case of normal goods.
Factors that Shift the Demand Curve
While the price change moves along the demand curve, several other factors can shift the entire demand curve, causing a change in demand at every price level. These include:
1. Consumer Income:
An increase in consumer income generally shifts the demand curve for normal goods to the right (an increase in demand), as consumers can afford to buy more at each price point. Conversely, a decrease in income shifts the curve to the left (a decrease in demand).
2. Prices of Related Goods:
- Substitute Goods: If the price of a substitute good increases, the demand for the good in question will increase, shifting the demand curve to the right. For example, if the price of coffee rises, the demand for tea might increase.
- Complementary Goods: If the price of a complementary good increases, the demand for the good in question will decrease, shifting the demand curve to the left. For instance, if the price of printers increases, the demand for printer ink might decrease.
3. Consumer Tastes and Preferences:
Changes in consumer preferences, influenced by factors like advertising, fashion trends, or technological advancements, can shift the demand curve. A positive shift occurs when preferences increase, and a negative shift when preferences decrease. For example, a successful marketing campaign for a particular brand of soda could shift its demand curve to the right.
4. Consumer Expectations:
Consumers' expectations about future prices or income can also impact current demand. If consumers anticipate a price increase, they might buy more now, shifting the demand curve to the right. Similarly, expectations of higher future income might lead to increased current consumption, causing a rightward shift.
5. Number of Buyers:
An increase in the number of consumers in the market will naturally shift the demand curve to the right, as more people are willing and able to purchase the good.
The Importance of the Downward-Sloping Demand Curve
Understanding the downward-sloping demand curve is critical for several reasons:
1. Business Decision-Making:
Businesses use this knowledge to set prices and forecast sales. They analyze the price elasticity of demand – the responsiveness of quantity demanded to price changes – to optimize pricing strategies and maximize profits.
2. Government Policy:
Governments utilize demand curves to analyze the effects of taxes, subsidies, and other policies on market outcomes. For example, understanding the demand elasticity for gasoline can help policymakers assess the impact of fuel taxes.
3. Economic Forecasting:
Economists use demand curves to model consumer behavior and predict future market trends, informing macroeconomic policies and investment decisions.
Exceptions and Nuances
While the downward-sloping demand curve is a general rule, there are some exceptions and nuances:
1. Giffen Goods:
Giffen goods are a rare exception where the demand curve can be upward sloping. These are typically inferior goods that constitute a significant portion of a consumer's budget. A price increase actually leads to an increase in quantity demanded because the income effect outweighs the substitution effect. This is because the price increase significantly reduces the consumer's purchasing power, forcing them to consume more of the cheaper (but inferior) good.
2. Veblen Goods:
Veblen goods are luxury goods whose demand increases as their price increases. This is due to the prestige and status associated with high prices. Consumers might buy more of a Veblen good precisely because it is expensive, signaling wealth and social status.
Conclusion: A Dynamic and Ever-Evolving Concept
The downward-sloping demand curve for a normal good is a cornerstone of economic theory. While it's a simplification of complex consumer behavior, it provides a valuable framework for understanding market dynamics. Recognizing the interplay of the substitution effect, income effect, and diminishing marginal utility, along with the factors that shift the demand curve, is crucial for businesses, policymakers, and economists alike. Understanding the exceptions and nuances, such as Giffen and Veblen goods, further refines this understanding, highlighting the dynamic and ever-evolving nature of consumer preferences and market forces. By acknowledging the limitations and complexities while appreciating the core principles, we gain a more nuanced and accurate perspective on the intricate world of market demand. Continuous research and analysis of consumer behaviour are crucial to refining our understanding of this fundamental concept and adapting to the ever-changing market landscape.
Latest Posts
Latest Posts
-
Completa Las Oraciones De Forma Logica Usando Pero O Sino
Mar 29, 2025
-
Which Poetry Element Affects The Poems Sound
Mar 29, 2025
-
Ruben Cree Que La Leccion 3 Es Facil Ellos
Mar 29, 2025
-
Transfer Cases Without A Center Differential Are Used On
Mar 29, 2025
-
What Was The Main Reason That The Framers Created Federalism
Mar 29, 2025
Related Post
Thank you for visiting our website which covers about The Demand Curve For A Normal Good Is ______________. . We hope the information provided has been useful to you. Feel free to contact us if you have any questions or need further assistance. See you next time and don't miss to bookmark.
