The Sampling Distribution Of The Difference Helps Us Determine ________.
Breaking News Today
Mar 20, 2025 · 7 min read
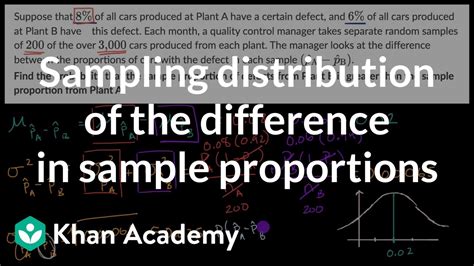
Table of Contents
The Sampling Distribution of the Difference Helps Us Determine the Significance of Differences Between Two Groups
The sampling distribution of the difference between two means, or proportions, is a crucial concept in statistical inference. It helps us determine whether observed differences between two groups are statistically significant or simply due to random chance. Understanding this distribution allows us to make informed decisions about hypotheses, draw conclusions from data, and ultimately, make better predictions. This article will delve deep into the sampling distribution of the difference, exploring its properties, applications, and importance in hypothesis testing.
Understanding the Foundation: Sampling Distributions
Before diving into the specifics of the difference, let's refresh our understanding of sampling distributions in general. A sampling distribution is the probability distribution of a statistic (like the mean, proportion, or difference between means) obtained from a large number of samples drawn from a population. It's not the distribution of the raw data itself, but rather the distribution of summary statistics calculated from those data sets.
For instance, if you repeatedly sample from a population and calculate the mean of each sample, the distribution of these sample means will form the sampling distribution of the mean. This distribution is central to many statistical tests, providing a framework for understanding the variability inherent in sample data.
The Sampling Distribution of the Difference Between Two Means
Now let's focus on the sampling distribution of the difference between two means. Imagine we have two populations, Population A and Population B. We draw numerous random samples from each population, calculate the mean of each sample, and then find the difference between the sample means of A and B for each pair of samples. The collection of these differences forms the sampling distribution of the difference between the two means.
Key Properties:
-
Center: The center of this distribution, its mean, is the difference between the population means (μ<sub>A</sub> - μ<sub>B</sub>). If the population means are equal, the center will be zero.
-
Spread: The spread, or standard deviation, of this distribution is determined by the standard deviations of the two populations (σ<sub>A</sub> and σ<sub>B</sub>) and the sample sizes (n<sub>A</sub> and n<sub>B</sub>). This is often represented by the standard error of the difference. Larger sample sizes lead to a smaller standard error, resulting in a narrower distribution.
-
Shape: If the sample sizes are sufficiently large (generally, n<sub>A</sub> ≥ 30 and n<sub>B</sub> ≥ 30), the central limit theorem tells us that the sampling distribution of the difference will be approximately normal, regardless of the shape of the original population distributions. For smaller sample sizes, the shape will depend on the original populations' distributions. If the original distributions are normal, then the sampling distribution of the difference will also be normal.
The Sampling Distribution of the Difference Between Two Proportions
Similar to the means, we can construct a sampling distribution for the difference between two proportions. This is particularly useful when comparing the proportion of individuals with a certain characteristic in two different groups. For example, we might compare the proportion of males and females who prefer a certain brand of coffee.
The key properties are analogous to the sampling distribution of the difference between two means:
-
Center: The center is the difference between the population proportions (p<sub>A</sub> - p<sub>B</sub>).
-
Spread: The spread is determined by the population proportions and sample sizes, reflected in the standard error of the difference between proportions.
-
Shape: For sufficiently large sample sizes (n<sub>A</sub>p<sub>A</sub> ≥ 10, n<sub>A</sub>(1-p<sub>A</sub>) ≥ 10, n<sub>B</sub>p<sub>B</sub> ≥ 10, n<sub>B</sub>(1-p<sub>B</sub>) ≥ 10), the sampling distribution of the difference approximates a normal distribution.
Hypothesis Testing and the Sampling Distribution
The sampling distribution of the difference is the cornerstone of many hypothesis tests involving two groups. The most common applications involve testing for a significant difference between:
-
Two population means: Is there a significant difference in average income between two cities? Is there a significant difference in the average height of men and women?
-
Two population proportions: Is there a significant difference in the proportion of voters who support candidate A versus candidate B? Is there a significant difference in the click-through rates of two different ad designs?
The process typically involves the following steps:
-
State the hypotheses: Formulate the null hypothesis (H<sub>0</sub>), which usually states there is no difference between the two populations (e.g., μ<sub>A</sub> - μ<sub>B</sub> = 0 or p<sub>A</sub> - p<sub>B</sub> = 0), and the alternative hypothesis (H<sub>1</sub>), which states there is a difference (e.g., μ<sub>A</sub> - μ<sub>B</sub> ≠ 0, μ<sub>A</sub> - μ<sub>B</sub> > 0, or μ<sub>A</sub> - μ<sub>B</sub> < 0).
-
Determine the significance level (α): This is the probability of rejecting the null hypothesis when it is actually true (Type I error). A common significance level is 0.05.
-
Calculate the test statistic: This involves calculating the difference between the sample means or proportions and standardizing it using the standard error of the difference. The resulting value is often a t-statistic or z-statistic, depending on the sample size and assumptions about the population distributions.
-
Determine the p-value: The p-value is the probability of obtaining a test statistic as extreme as, or more extreme than, the one observed, assuming the null hypothesis is true. It represents the strength of evidence against the null hypothesis.
-
Make a decision: If the p-value is less than or equal to the significance level (α), we reject the null hypothesis and conclude there is a statistically significant difference between the two groups. If the p-value is greater than α, we fail to reject the null hypothesis.
Practical Applications and Examples
The sampling distribution of the difference has numerous practical applications across various fields:
-
Medicine: Comparing the effectiveness of two different treatments for a disease. Is one drug significantly more effective than another in reducing symptoms?
-
Education: Evaluating the impact of a new teaching method. Does the new method significantly improve student test scores compared to the traditional method?
-
Marketing: Assessing the effectiveness of two different advertising campaigns. Does one campaign generate significantly more sales than the other?
-
Social Sciences: Investigating differences in attitudes or behaviors between different demographic groups. Is there a significant difference in political views between men and women?
Example: Let's consider a study comparing the average lifespan of two different breeds of dogs. Researchers collect data on the lifespans of a sample of each breed. By constructing the sampling distribution of the difference in average lifespans, they can test the hypothesis that there is a significant difference in lifespan between the two breeds. A small p-value would indicate that the observed difference in lifespan is statistically significant and unlikely due to random chance.
Limitations and Considerations
While the sampling distribution of the difference is a powerful tool, it's crucial to be aware of its limitations:
-
Assumptions: Many statistical tests based on this distribution rely on certain assumptions, such as independence of observations, normality of the population distributions (or large sample sizes), and equal variances (in some cases). Violation of these assumptions can affect the validity of the results.
-
Statistical Significance vs. Practical Significance: A statistically significant difference doesn't always imply a practically significant difference. A small difference might be statistically significant with a large sample size, but it might be too small to have any real-world impact. Always consider the context and magnitude of the observed difference.
-
Causation vs. Correlation: Even if a statistically significant difference is found, it doesn't necessarily mean that one group causes the difference in the other. Correlation does not equal causation. Other factors might be responsible for the observed difference.
Conclusion: A Powerful Tool for Inference
The sampling distribution of the difference is a fundamental concept in statistical inference. It empowers us to move beyond simply observing differences between groups and to determine whether those differences are likely to be real or simply due to chance variation. By understanding its properties and applications, researchers and analysts can make more informed decisions, draw more reliable conclusions, and contribute to a deeper understanding of the world around us. While it's crucial to be aware of its limitations and interpret results cautiously, the sampling distribution of the difference remains a powerful and indispensable tool in the realm of statistical analysis. Mastering this concept is key to effectively analyzing data and drawing meaningful conclusions from comparative studies.
Latest Posts
Latest Posts
-
Which Prohibited Personnel Practice Promotes Overall Fairness
Mar 20, 2025
-
Esta Ser La Escuela Pequena El Pais
Mar 20, 2025
-
X Ray Images Of The Sun Generally Show The
Mar 20, 2025
-
Why Is An Operational Definition Necessary When Reporting Research Findings
Mar 20, 2025
-
What Is The Main Goal Of Recommended Dietary Allowances Rdas
Mar 20, 2025
Related Post
Thank you for visiting our website which covers about The Sampling Distribution Of The Difference Helps Us Determine ________. . We hope the information provided has been useful to you. Feel free to contact us if you have any questions or need further assistance. See you next time and don't miss to bookmark.
