Which Explains Why The Graph Is Not A Function
Breaking News Today
Mar 14, 2025 · 5 min read
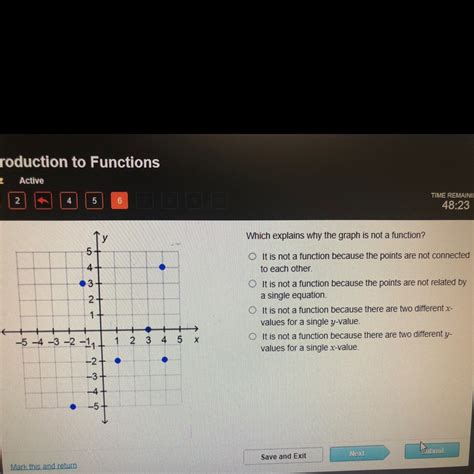
Table of Contents
Why Isn't This a Graph of a Function? A Comprehensive Guide
Understanding the difference between a relation and a function is fundamental in mathematics, particularly in algebra and calculus. While all functions are relations, not all relations are functions. This article delves deep into the concept of functions, explaining clearly why a graph might not represent a function, providing numerous examples and visual aids to solidify your understanding. We'll cover the crucial vertical line test, explore various scenarios where graphs fail the test, and discuss the implications of this distinction.
What is a Function?
A function is a special type of relation where each input (x-value) corresponds to exactly one output (y-value). Think of it like a machine: you feed it an input, and it gives you one, and only one, specific output. There's no ambiguity. This one-to-one (or many-to-one) relationship is the defining characteristic of a function.
A relation, on the other hand, is a more general term. It simply describes a set of ordered pairs (x, y). A relation can have multiple y-values associated with a single x-value.
The Vertical Line Test: Your Function Detective
The easiest way to determine if a graph represents a function is using the vertical line test. This simple visual test helps you quickly identify whether the graph satisfies the function definition:
How to Perform the Vertical Line Test:
- Imagine drawing a vertical line across the entire graph.
- If the vertical line intersects the graph at more than one point at any position, then the graph does not represent a function.
- If the vertical line intersects the graph at only one point (or zero points, meaning no y-value exists for that x-value) at every position, then the graph does represent a function.
Why Does This Work?
The vertical line test is a visual representation of the function definition. If a vertical line intersects the graph at multiple points, it means that there are multiple y-values associated with a single x-value, violating the fundamental rule of a function (one input, one output).
Examples of Graphs that are NOT Functions
Let's look at several examples to illustrate graphs that fail the vertical line test and, therefore, are not functions:
Example 1: The Circle
Consider the equation of a circle: x² + y² = r², where 'r' is the radius. If you were to graph this equation, you'd get a perfect circle. Now, apply the vertical line test. Any vertical line drawn through the circle (except those tangent to the edges) will intersect the circle at two points. This means that for a single x-value, there are two corresponding y-values. Therefore, a circle is not a function.
Example 2: A Parabola Opening Sideways
A parabola typically represented by y = x² is a function. However, a parabola that opens sideways, such as x = y², fails the vertical line test. For any x-value (except the vertex), there are two corresponding y-values. Thus, it is not a function.
Example 3: A Graph with Multiple Branches
Imagine a graph with multiple disconnected branches, where a vertical line can intersect multiple branches. This graph will also fail the vertical line test. Even though each branch individually might be a function, the entire graph, as presented, is not. For example, consider a graph with two distinct lines defined by y=x and y=-x.
Example 4: A Graph with a Vertical Line
Any graph containing a vertical line will immediately fail the vertical line test. A vertical line represents an infinite number of y-values associated with a single x-value. Hence, it’s not a function.
Example 5: Piecewise Functions (that are NOT functions)
Piecewise functions can be tricky. While many piecewise functions are indeed functions, some are not. Consider a piecewise function where two separate pieces overlap and share the same x-value but have different y-values. This would directly violate the vertical line test. For example, a piecewise function defined as:
y = x if x ≥ 0 y = -x if x < 0
This function seems straightforward, but if the two pieces had overlapping x-values with different y-values, it would fail the vertical line test.
Why the Distinction Matters
Understanding whether a graph represents a function is crucial for several reasons:
- Mathematical Operations: Many mathematical operations, particularly in calculus (like finding derivatives and integrals), are only defined for functions.
- Modeling Real-World Phenomena: Functions are essential for modeling real-world phenomena. Many relationships in science and engineering can be represented as functions, where the input is an independent variable and the output is a dependent variable. Using a relation instead of a function in this case would lead to inaccurate or incomplete modeling.
- Computer Programming: Functions are the building blocks of computer programs. Understanding the properties of functions is crucial in writing efficient and error-free code.
- Interpreting Data: Graphs of functions often provide a more precise and clear representation of data than relations which lack the clear input-output correspondence of a function.
Advanced Considerations: Functions of Multiple Variables
The vertical line test only applies to functions of a single variable (typically represented as y = f(x)). Functions of multiple variables (e.g., z = f(x, y)) are represented as surfaces in three-dimensional space. The equivalent test for multivariable functions is slightly more complex and involves examining the relationship between inputs and outputs in a three-dimensional (or higher) space. These functions also have rules, such as every set of x and y values resulting in only one z value, in order to be considered a function.
Conclusion
Determining whether a graph represents a function is a fundamental concept in mathematics. The vertical line test provides a simple and effective way to visually check this. Understanding the distinction between functions and relations is crucial for further study in mathematics and its application in various fields. By mastering this concept, you'll have a stronger foundation for tackling more advanced mathematical concepts and problem-solving. Remember to always consider the one-input-one-output rule and visualize the vertical line test when determining if a graph depicts a function.
Latest Posts
Latest Posts
-
A Nail Salon Pays 2500 In Rent
Mar 15, 2025
-
What Are The Central Ideas In A Play
Mar 15, 2025
-
In Most Spanish Speaking Countries Married Women Legally
Mar 15, 2025
-
The Fed May Respond To A Recession By
Mar 15, 2025
-
Describe What Brownfields Are And How They Can Be Assessed
Mar 15, 2025
Related Post
Thank you for visiting our website which covers about Which Explains Why The Graph Is Not A Function . We hope the information provided has been useful to you. Feel free to contact us if you have any questions or need further assistance. See you next time and don't miss to bookmark.
