Which Of The Following Are Resistant Measures Of Dispersion
Breaking News Today
Mar 26, 2025 · 6 min read
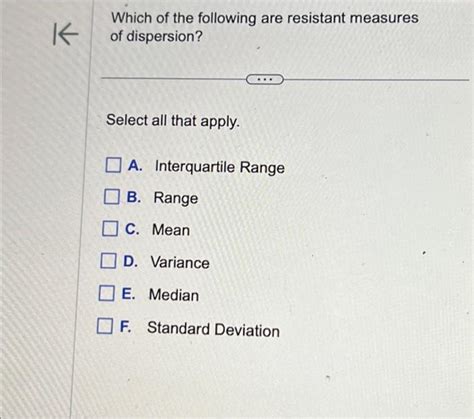
Table of Contents
Which of the following are resistant measures of dispersion?
Measures of dispersion describe the spread or variability of a dataset. While some measures are heavily influenced by outliers (extreme values), others are more resistant to their effects. Understanding which measures are resistant is crucial for accurate data analysis and interpretation, particularly when dealing with datasets that might contain errors or unusual values. This article delves into the different measures of dispersion, highlighting which ones are resistant and why.
Understanding Measures of Dispersion
Before diving into resistant measures, let's review the common types of dispersion:
-
Range: This is the simplest measure, calculated as the difference between the maximum and minimum values in a dataset. It's highly susceptible to outliers because a single extreme value can drastically inflate the range.
-
Interquartile Range (IQR): The IQR is the difference between the 75th percentile (third quartile, Q3) and the 25th percentile (first quartile, Q1) of a dataset. It's a resistant measure because it focuses on the central 50% of the data, effectively ignoring extreme values at the tails.
-
Variance: The variance measures the average squared deviation of each data point from the mean. It's sensitive to outliers because large deviations are squared, magnifying their impact.
-
Standard Deviation: This is the square root of the variance. Like the variance, it's heavily influenced by outliers.
-
Mean Absolute Deviation (MAD): The MAD calculates the average of the absolute deviations from the mean. While less sensitive than the variance and standard deviation, it is still affected by outliers, although to a lesser extent.
Resistant Measures of Dispersion: A Deeper Dive
The key characteristic of a resistant measure is its ability to provide a stable and reliable representation of dispersion even when outliers are present. Let's examine the most commonly used resistant measures:
1. Interquartile Range (IQR): The Robust Choice
As mentioned earlier, the IQR is a highly resistant measure. Its robustness stems from its focus on the central portion of the data. Outliers, by definition, lie outside this central region and therefore have no influence on the IQR calculation. This makes the IQR a valuable tool when dealing with datasets suspected of containing errors or extreme values.
How to Calculate the IQR:
- Order the data: Arrange your data points in ascending order.
- Find the quartiles: The first quartile (Q1) is the value that separates the bottom 25% of the data from the top 75%. The third quartile (Q3) separates the bottom 75% from the top 25%. Various methods exist to find quartiles, including linear interpolation.
- Calculate the IQR: Subtract Q1 from Q3: IQR = Q3 - Q1.
Advantages of Using IQR:
- Robustness to outliers: Its primary strength.
- Easy to understand and calculate: Relatively straightforward compared to other measures.
- Provides insights into the central spread: Focuses on the typical dispersion within the dataset.
Limitations of Using IQR:
- Ignores information in the tails: While this is an advantage in terms of resistance to outliers, it means the IQR might not fully capture the overall spread of the data if the tails contain significant information.
- Not as widely used as standard deviation: This can make it less familiar to some statisticians and data analysts.
2. Median Absolute Deviation (MAD): Another Robust Option
The Median Absolute Deviation (MAD) is another resistant measure of dispersion. It calculates the median of the absolute deviations from the data's median. This approach leverages the median's inherent resistance to outliers, making the MAD a robust alternative to the standard deviation.
How to Calculate the MAD:
- Calculate the median: Find the median (M) of your dataset.
- Calculate absolute deviations: For each data point, calculate the absolute difference from the median: |xᵢ - M|.
- Find the median of absolute deviations: Calculate the median of these absolute deviations. This is the MAD.
Advantages of Using MAD:
- Robustness to outliers: Similar to the IQR, the MAD is resistant to the influence of extreme values.
- Clear interpretation: It represents the typical absolute deviation from the central tendency (median).
- Suitable for skewed data: Because it uses the median, the MAD is less sensitive to skewness than measures that rely on the mean.
Limitations of Using MAD:
- Less common than standard deviation: It might be less familiar to some analysts.
- Slightly more complex to calculate: Compared to the IQR, the MAD requires a few more steps.
Comparing Resistant and Non-Resistant Measures
The following table summarizes the key differences between resistant and non-resistant measures of dispersion:
| Measure | Resistant | Sensitive to Outliers | Interpretation |
|---|---|---|---|
| Range | No | High | Simple difference between max and min values |
| Interquartile Range | Yes | Low | Spread of the central 50% of data |
| Variance | No | High | Average squared deviation from the mean |
| Standard Deviation | No | High | Square root of the variance |
| Mean Absolute Deviation | No | Moderate | Average absolute deviation from the mean |
| Median Absolute Deviation | Yes | Low | Median of the absolute deviations from the median |
Choosing the Right Measure: Context Matters
The choice of the appropriate measure of dispersion depends heavily on the context of your analysis. Consider these factors:
- Presence of outliers: If outliers are suspected or known to be present, resistant measures like the IQR or MAD are strongly recommended.
- Data distribution: For skewed data, the MAD might be preferable to the standard deviation, as it's less sensitive to the influence of extreme values on one side of the distribution.
- Interpretability: The IQR is generally easier to interpret than the MAD.
- Familiarity: If communicating your findings to others, consider using measures they are more likely to understand (though this shouldn't override the need for robust measures if outliers are present).
Practical Examples and Scenarios
Let's consider a few scenarios where resistant measures are crucial:
Scenario 1: Income Data
Income data often contains outliers due to the presence of high earners. Using the standard deviation to describe the income spread would be misleading as it would be heavily inflated by these high values. The IQR or MAD would offer a more accurate picture of the typical income spread within the population.
Scenario 2: Measurement Errors
In experimental settings, measurement errors can lead to outliers. Resistant measures help to minimize the effect of these errors on the overall dispersion estimate, providing a more reliable representation of the true variability.
Scenario 3: Quality Control
In quality control applications, outliers can represent defective products or process failures. Using resistant measures can help to identify the typical spread of quality characteristics while avoiding being unduly influenced by extreme values.
Conclusion: Embrace Robustness
When analyzing data, it's crucial to choose the right measure of dispersion. While measures like the standard deviation are commonly used, their sensitivity to outliers can lead to misleading results. Resistant measures like the Interquartile Range (IQR) and Median Absolute Deviation (MAD) provide robust and reliable alternatives, particularly when dealing with datasets that might contain extreme values or errors. Understanding their strengths and limitations is essential for accurate data analysis and meaningful interpretation. By incorporating these resistant measures into your data analysis workflow, you can enhance the accuracy and robustness of your findings. Remember to always consider the context of your data and choose the measure that best suits your specific needs.
Latest Posts
Latest Posts
-
A Special Purpose District Would Most Likely Be Created When A
Mar 29, 2025
-
When The Member Elects An Administrative Board
Mar 29, 2025
-
What Criteria Did The Aztecs Use To Evaluate Artistic Quality
Mar 29, 2025
-
Label The Appropriate Images In The Atp Cycle
Mar 29, 2025
-
The Patient Is Showing Persistent Pulseless Ventricular Tachycardia
Mar 29, 2025
Related Post
Thank you for visiting our website which covers about Which Of The Following Are Resistant Measures Of Dispersion . We hope the information provided has been useful to you. Feel free to contact us if you have any questions or need further assistance. See you next time and don't miss to bookmark.
